Conversation
Conversation reports can be viewed in the Reports Section. To access the section, click the Reports icon on homepage.
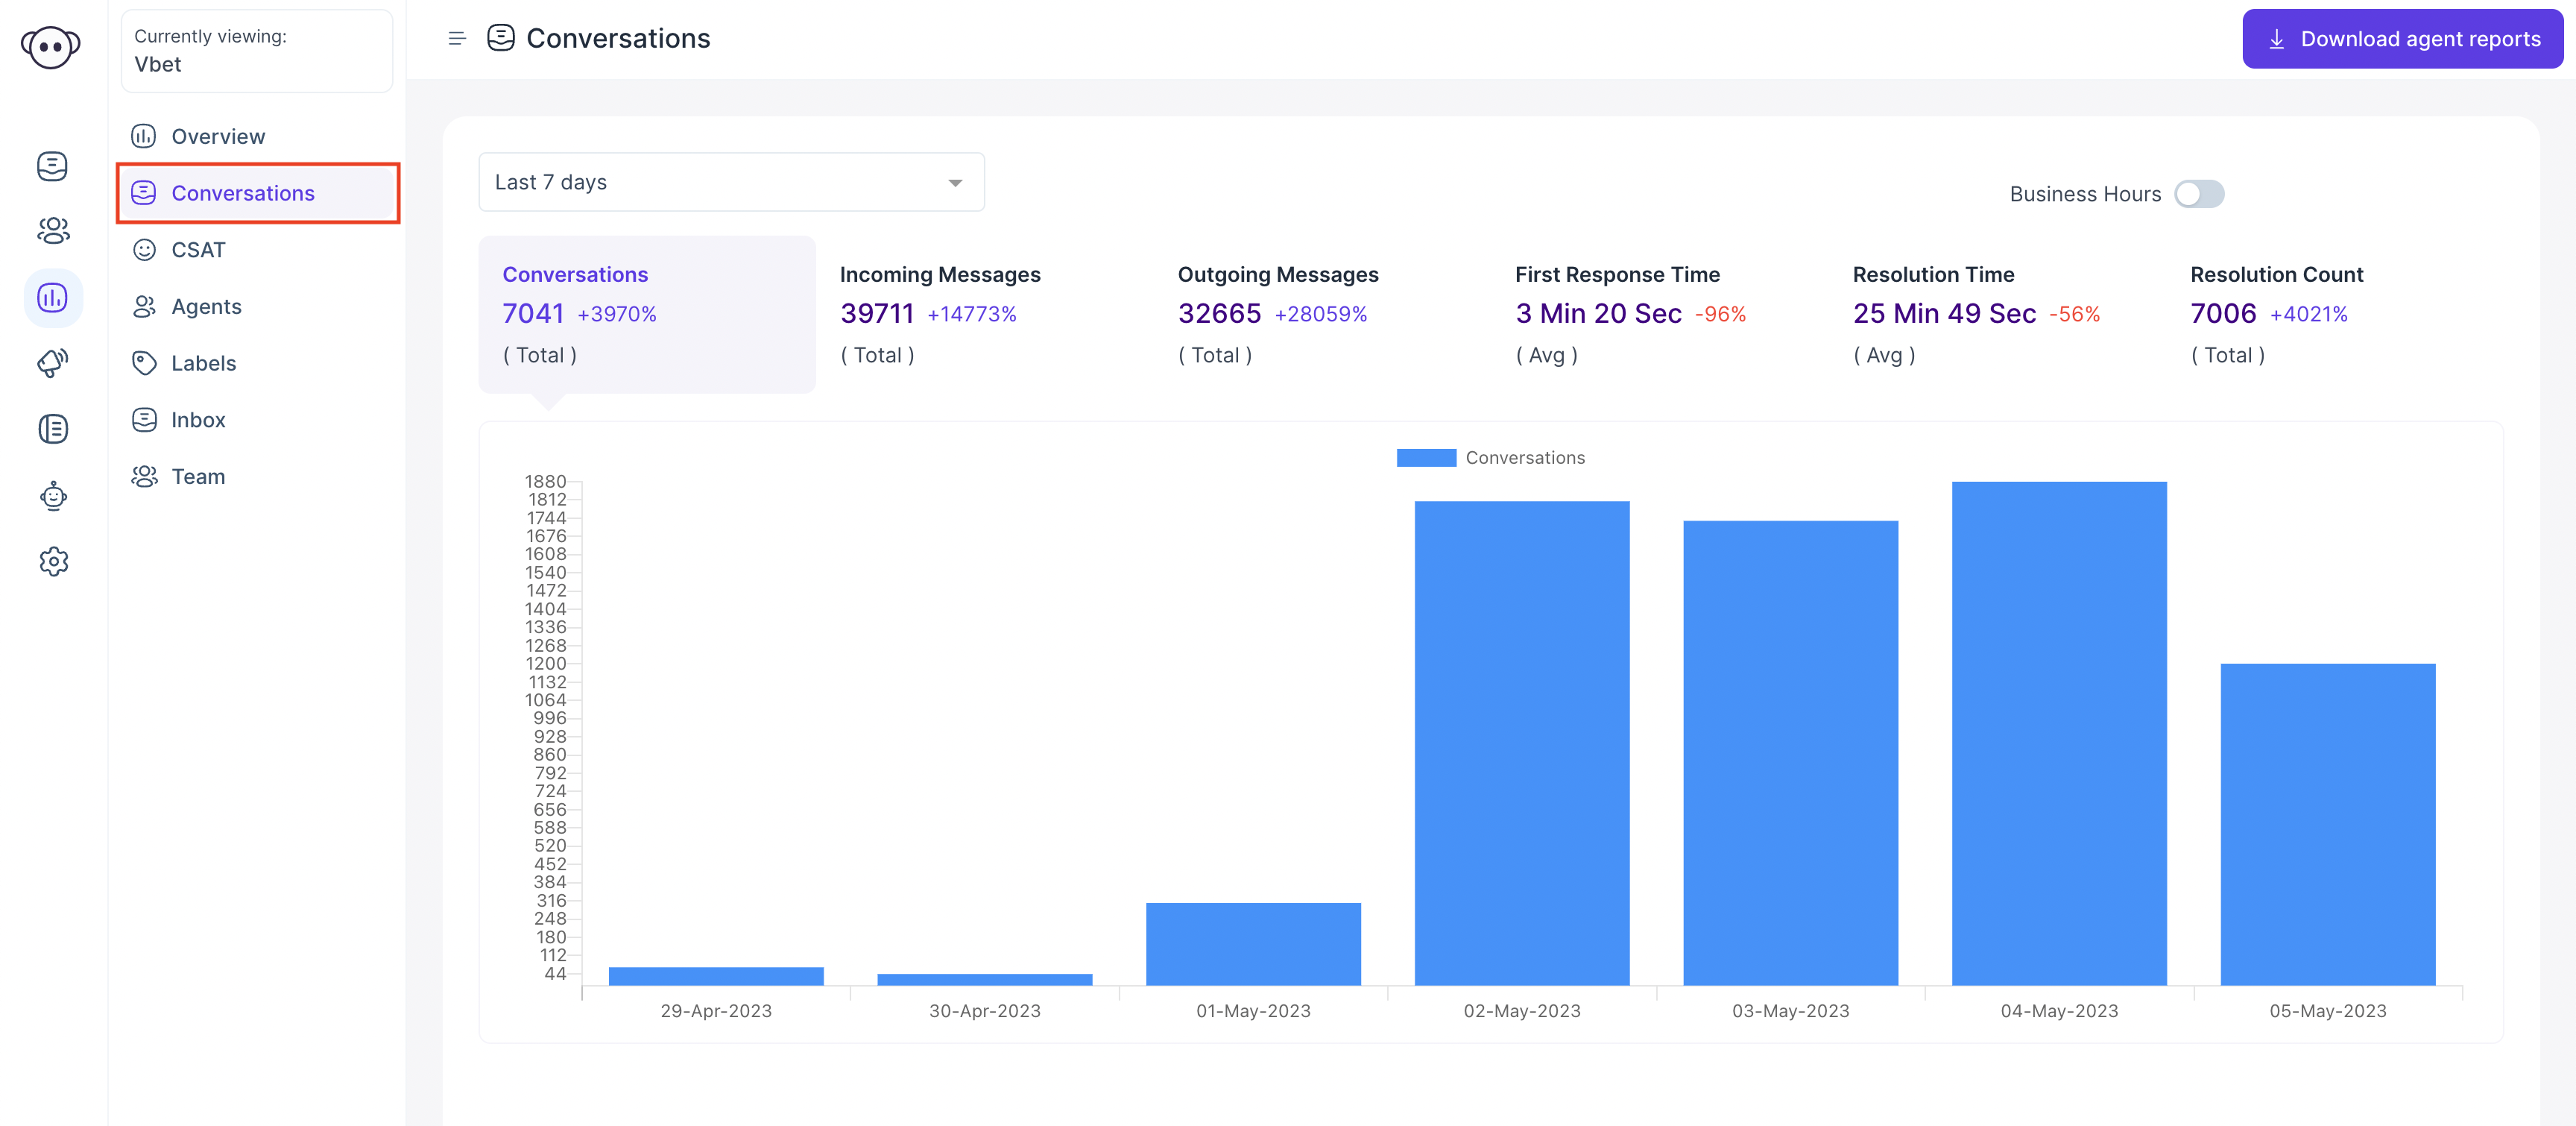
The below window opens up with Overview of the Reports. Now, click on conversations.
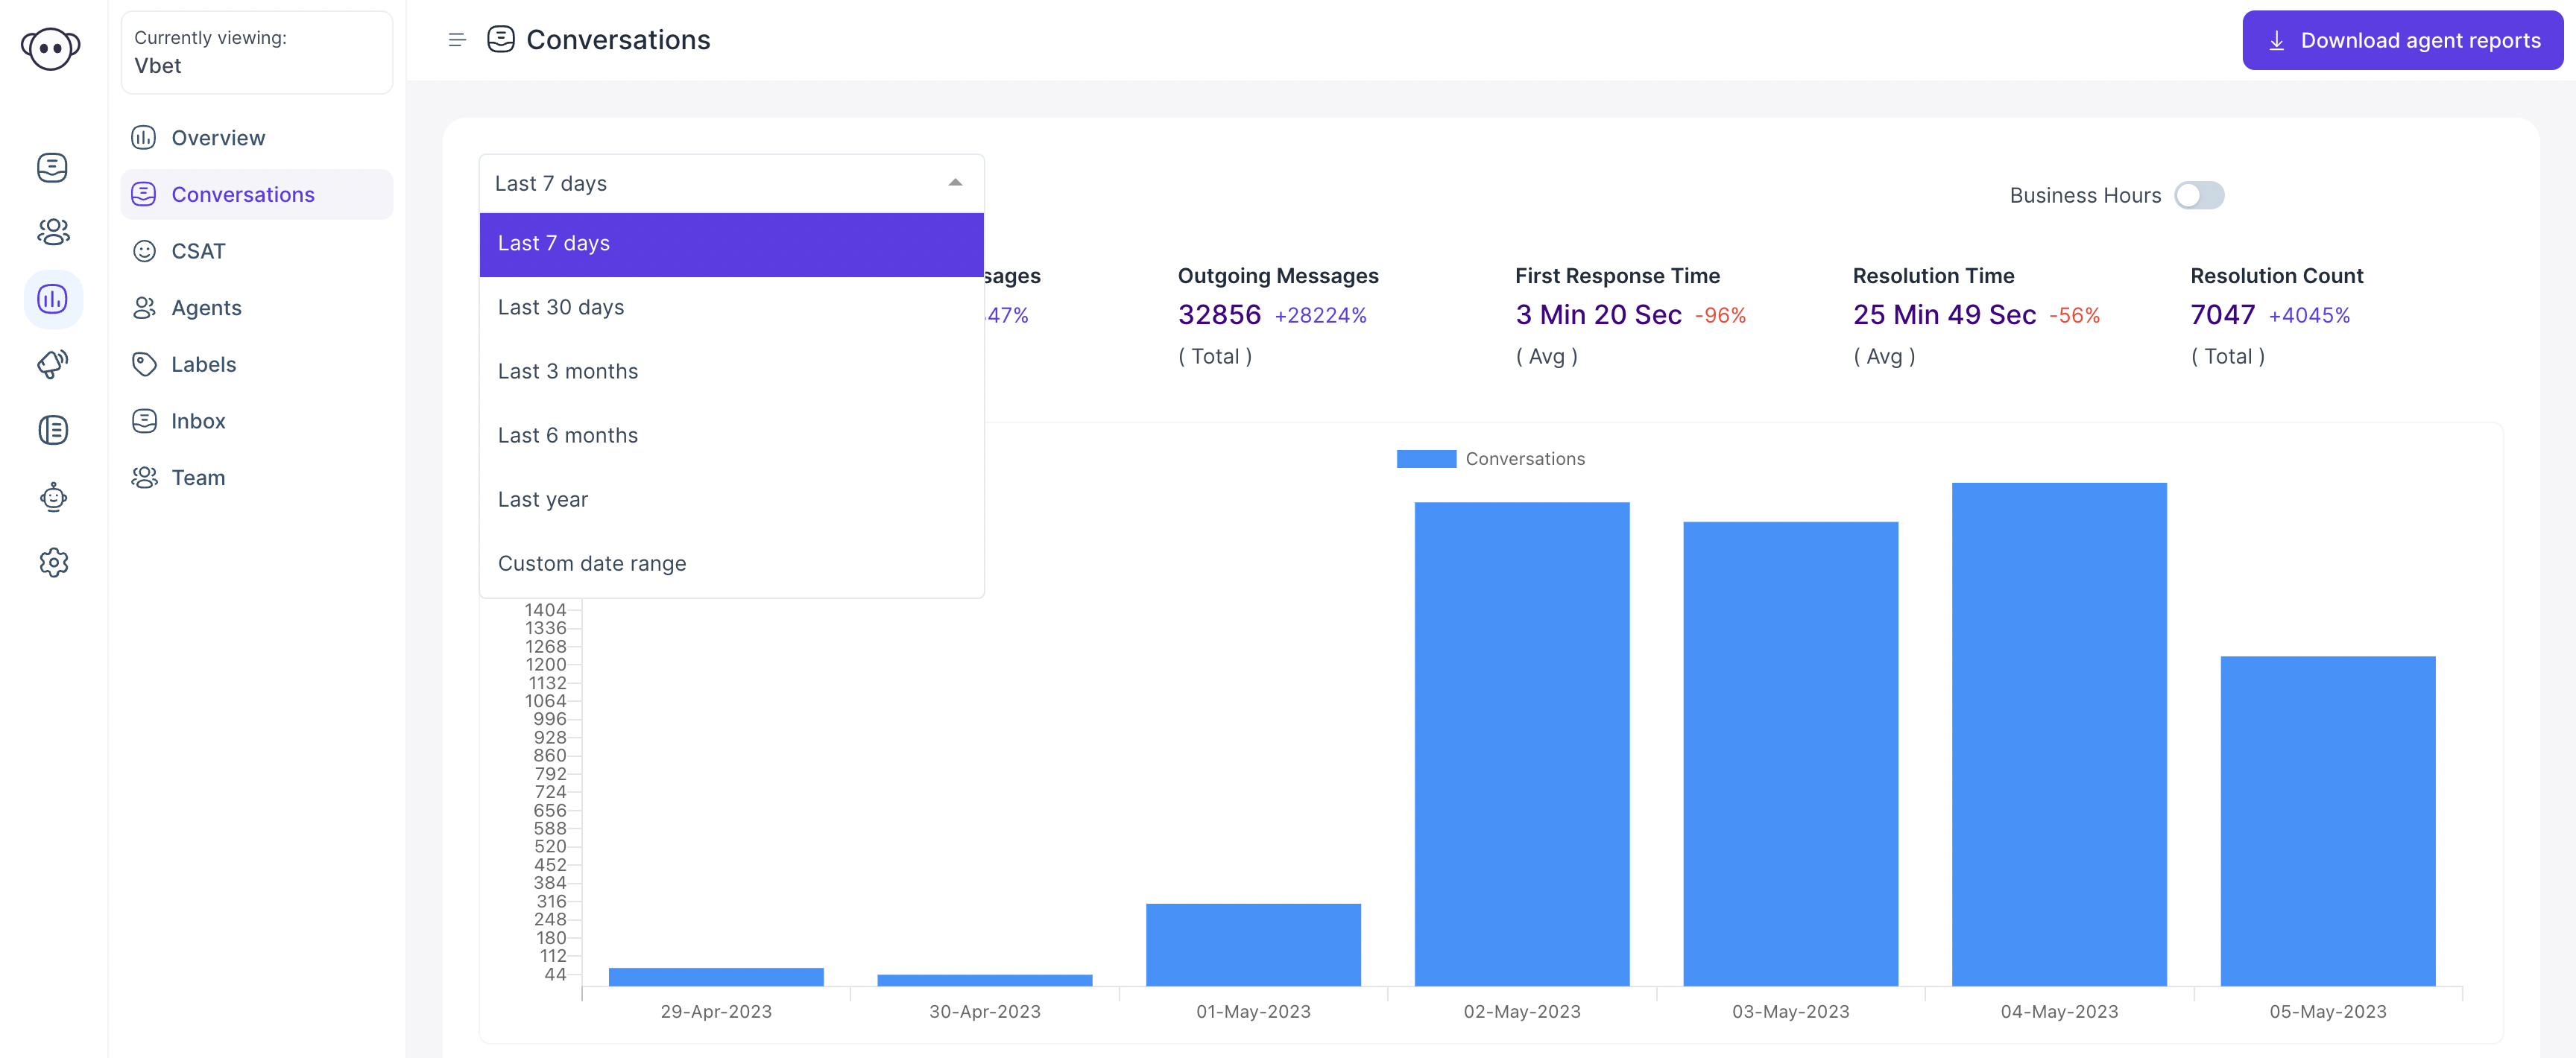
You can decide the time frame for your report. By default, the report covers the past 7 days, but you can also select a custom date range.
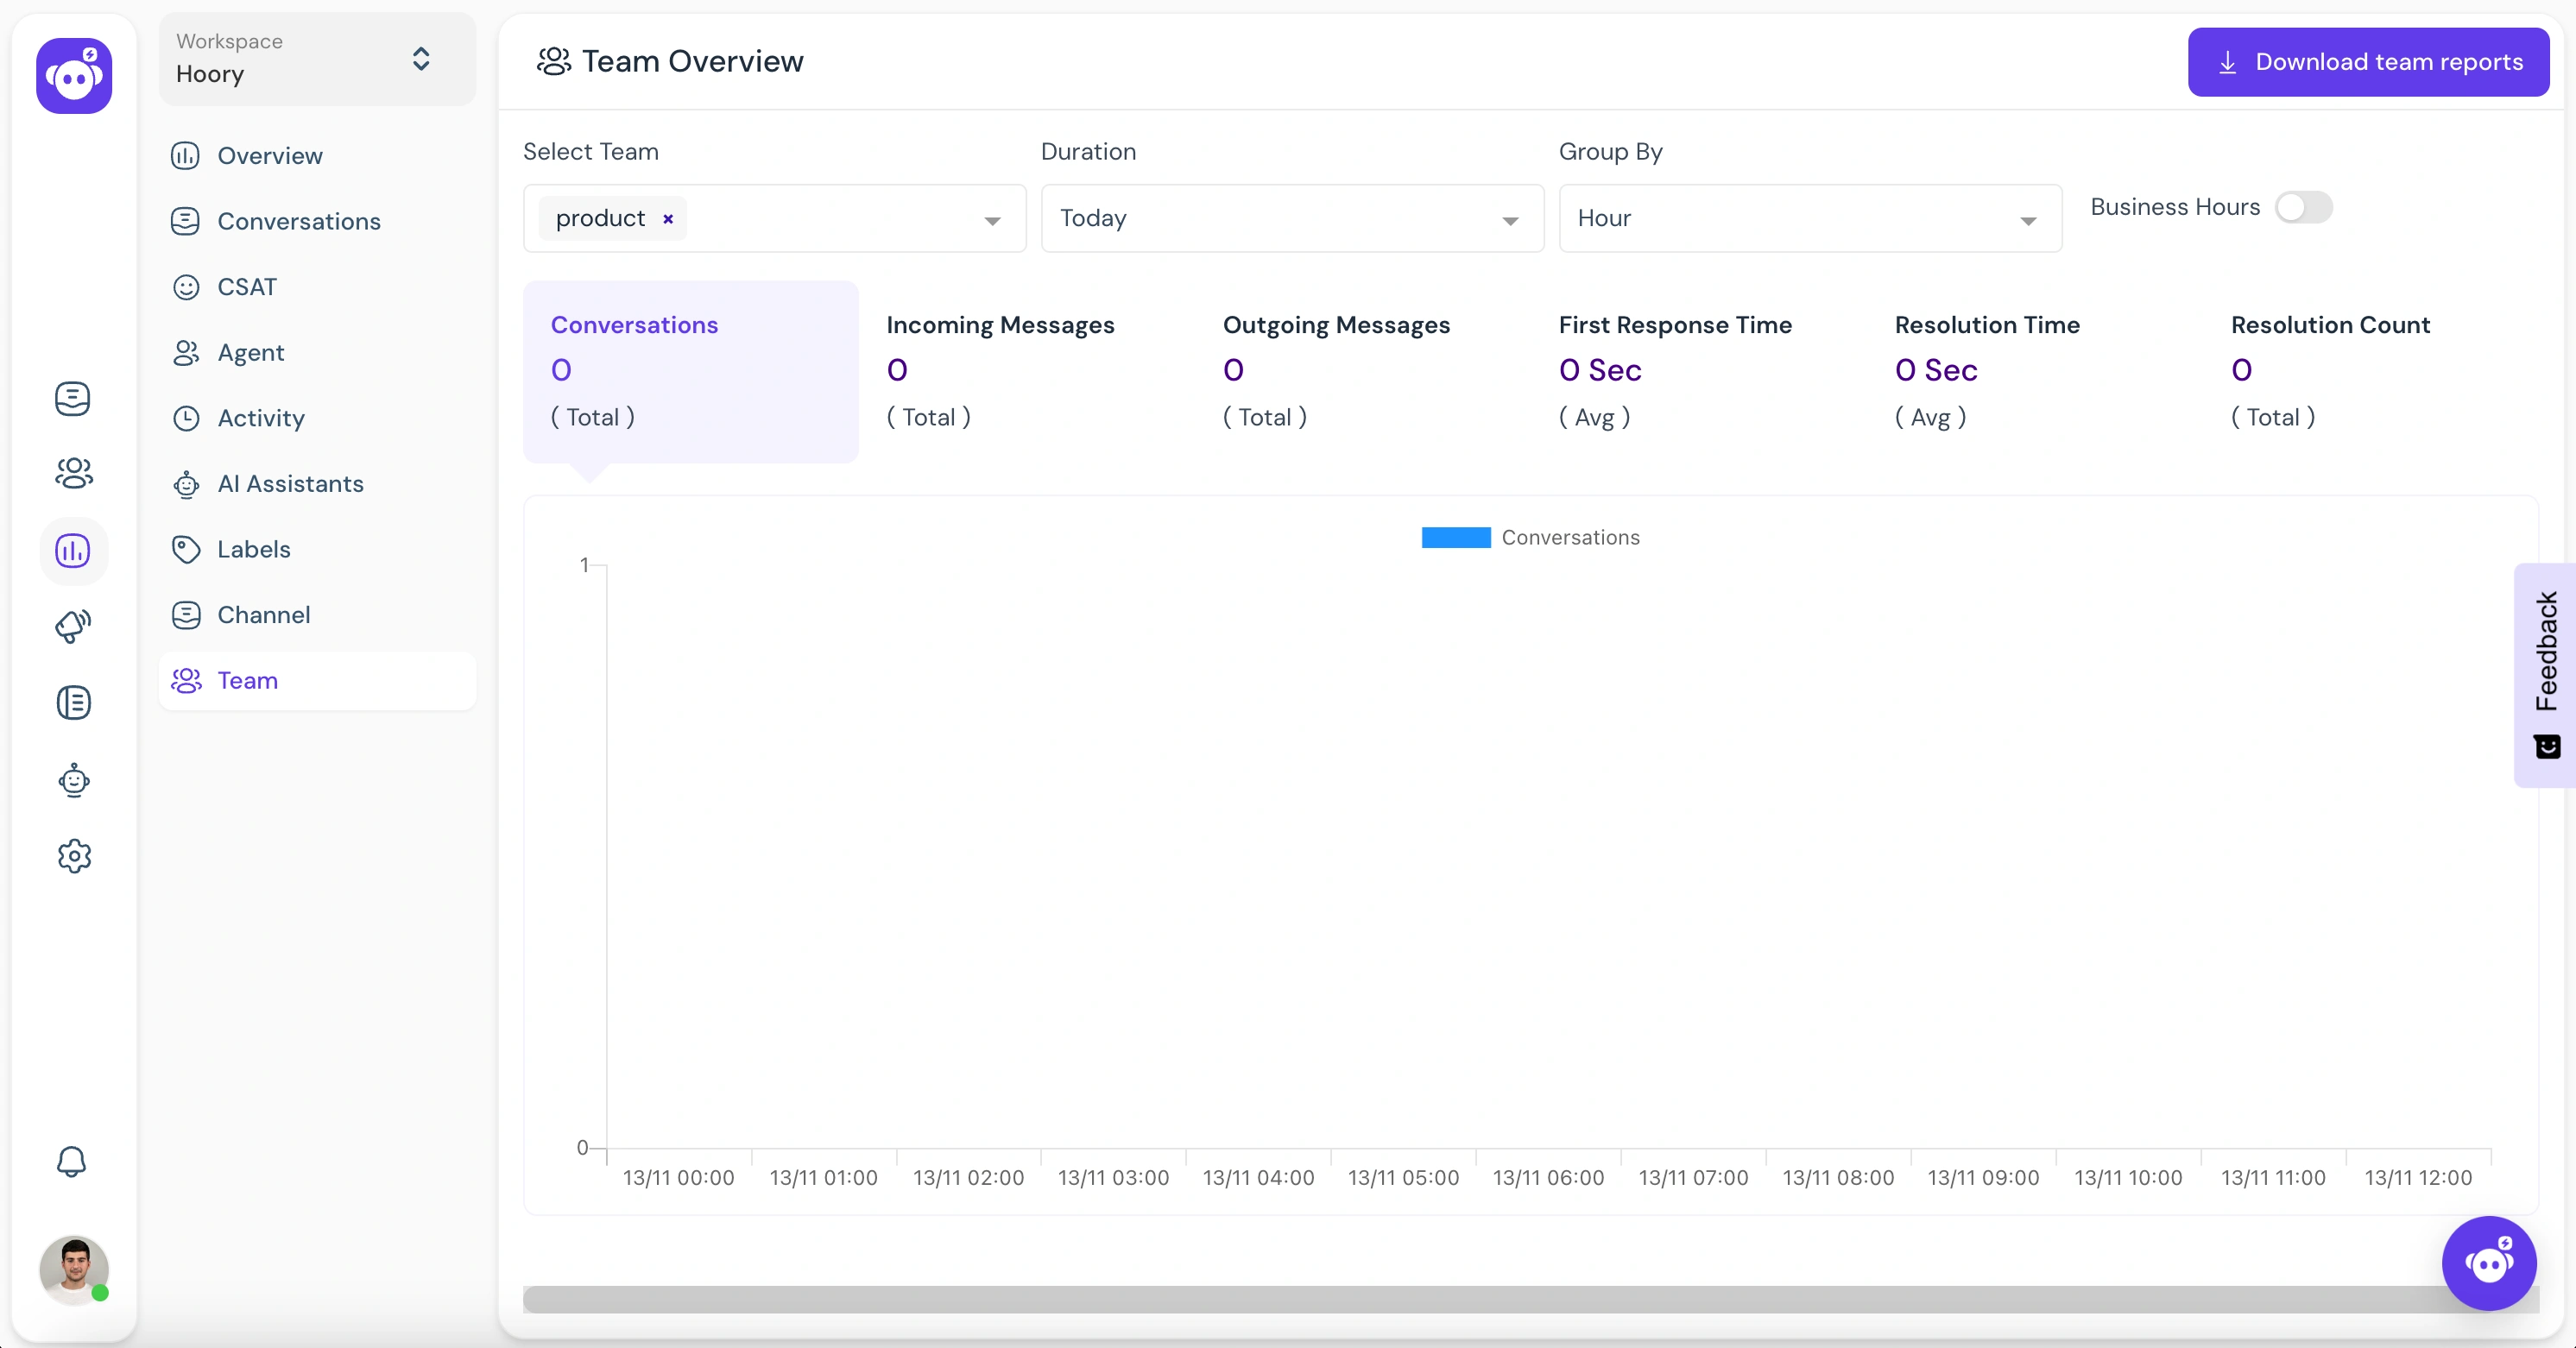
Reports can be grouped using the Group By filter. Each date range has a different filter. Here's how it looks.
| Date Range | Group By |
|---|---|
| Last 7 days | Day |
| Last 30 days | Day, Week |
| Last 3 months | Day, Week, Month |
| Last 6 months | Day, Week, Month |
| Last year | Day, Week, Month |
| Custom date range | Day, Week, Month, Year |
Conversations
Navigate to the Conversations tab from the Reports page, and you will find a graph showing all the conversations that have happened during the selected date range. Upon pointing the mouse to a particular chart, you can see the details of the conversations that happened that day. See a sample graph below.

Incoming Messages
Click the Incoming Messages tab in Reports, and you will find a graph showing the number of incoming messages on the selected date range. Upon pointing the mouse to a particular chart, the details of all incoming messages that have happened that day will appear. See the example below.

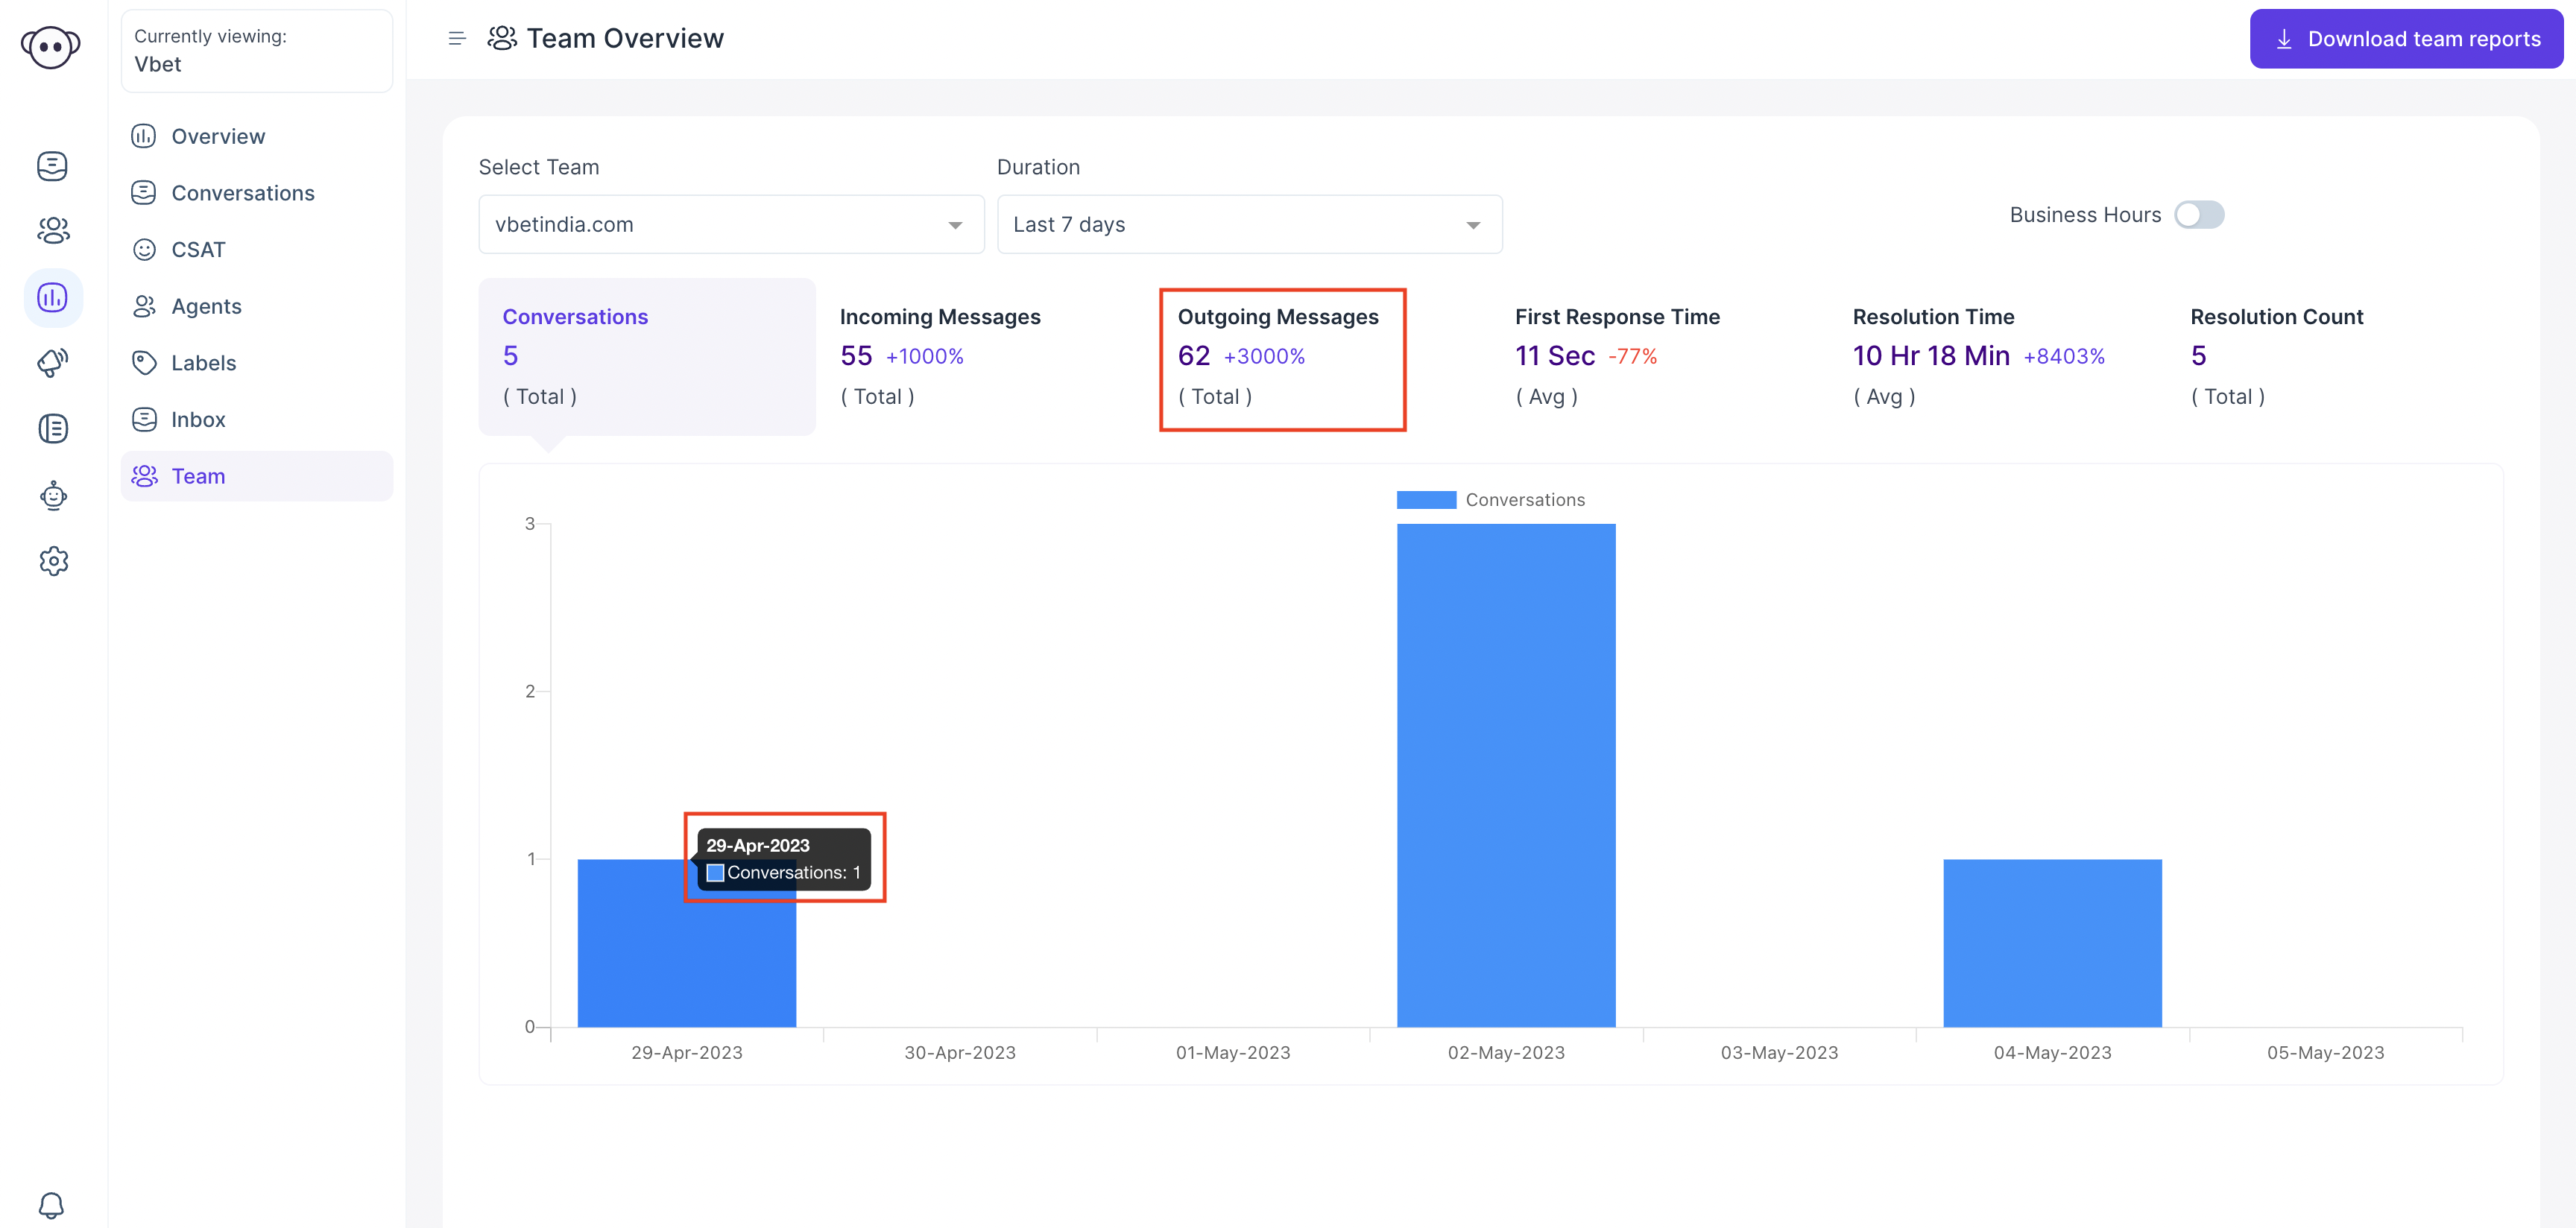
Outgoing Messages
Click the Outgoing Messages tab from the Reports page, and you will find a graph showing the number of outgoing messages on the selected date range. Upon pointing the mouse to a particular chart, you will see the details of outgoing messages that happened that day. See a sample graph below.
First Response Time
Click the First Response Time tab in Reports, and you will find a graph showing the average time taken to give a first response to a conversation with a customer. Upon pointing the mouse to a particular chart, you can see the average time for the first response and the number of conversations used to calculate the first response for that specific day. For example, on May 29, the average first response time was 1 Day 20 Hr based on four conversations.

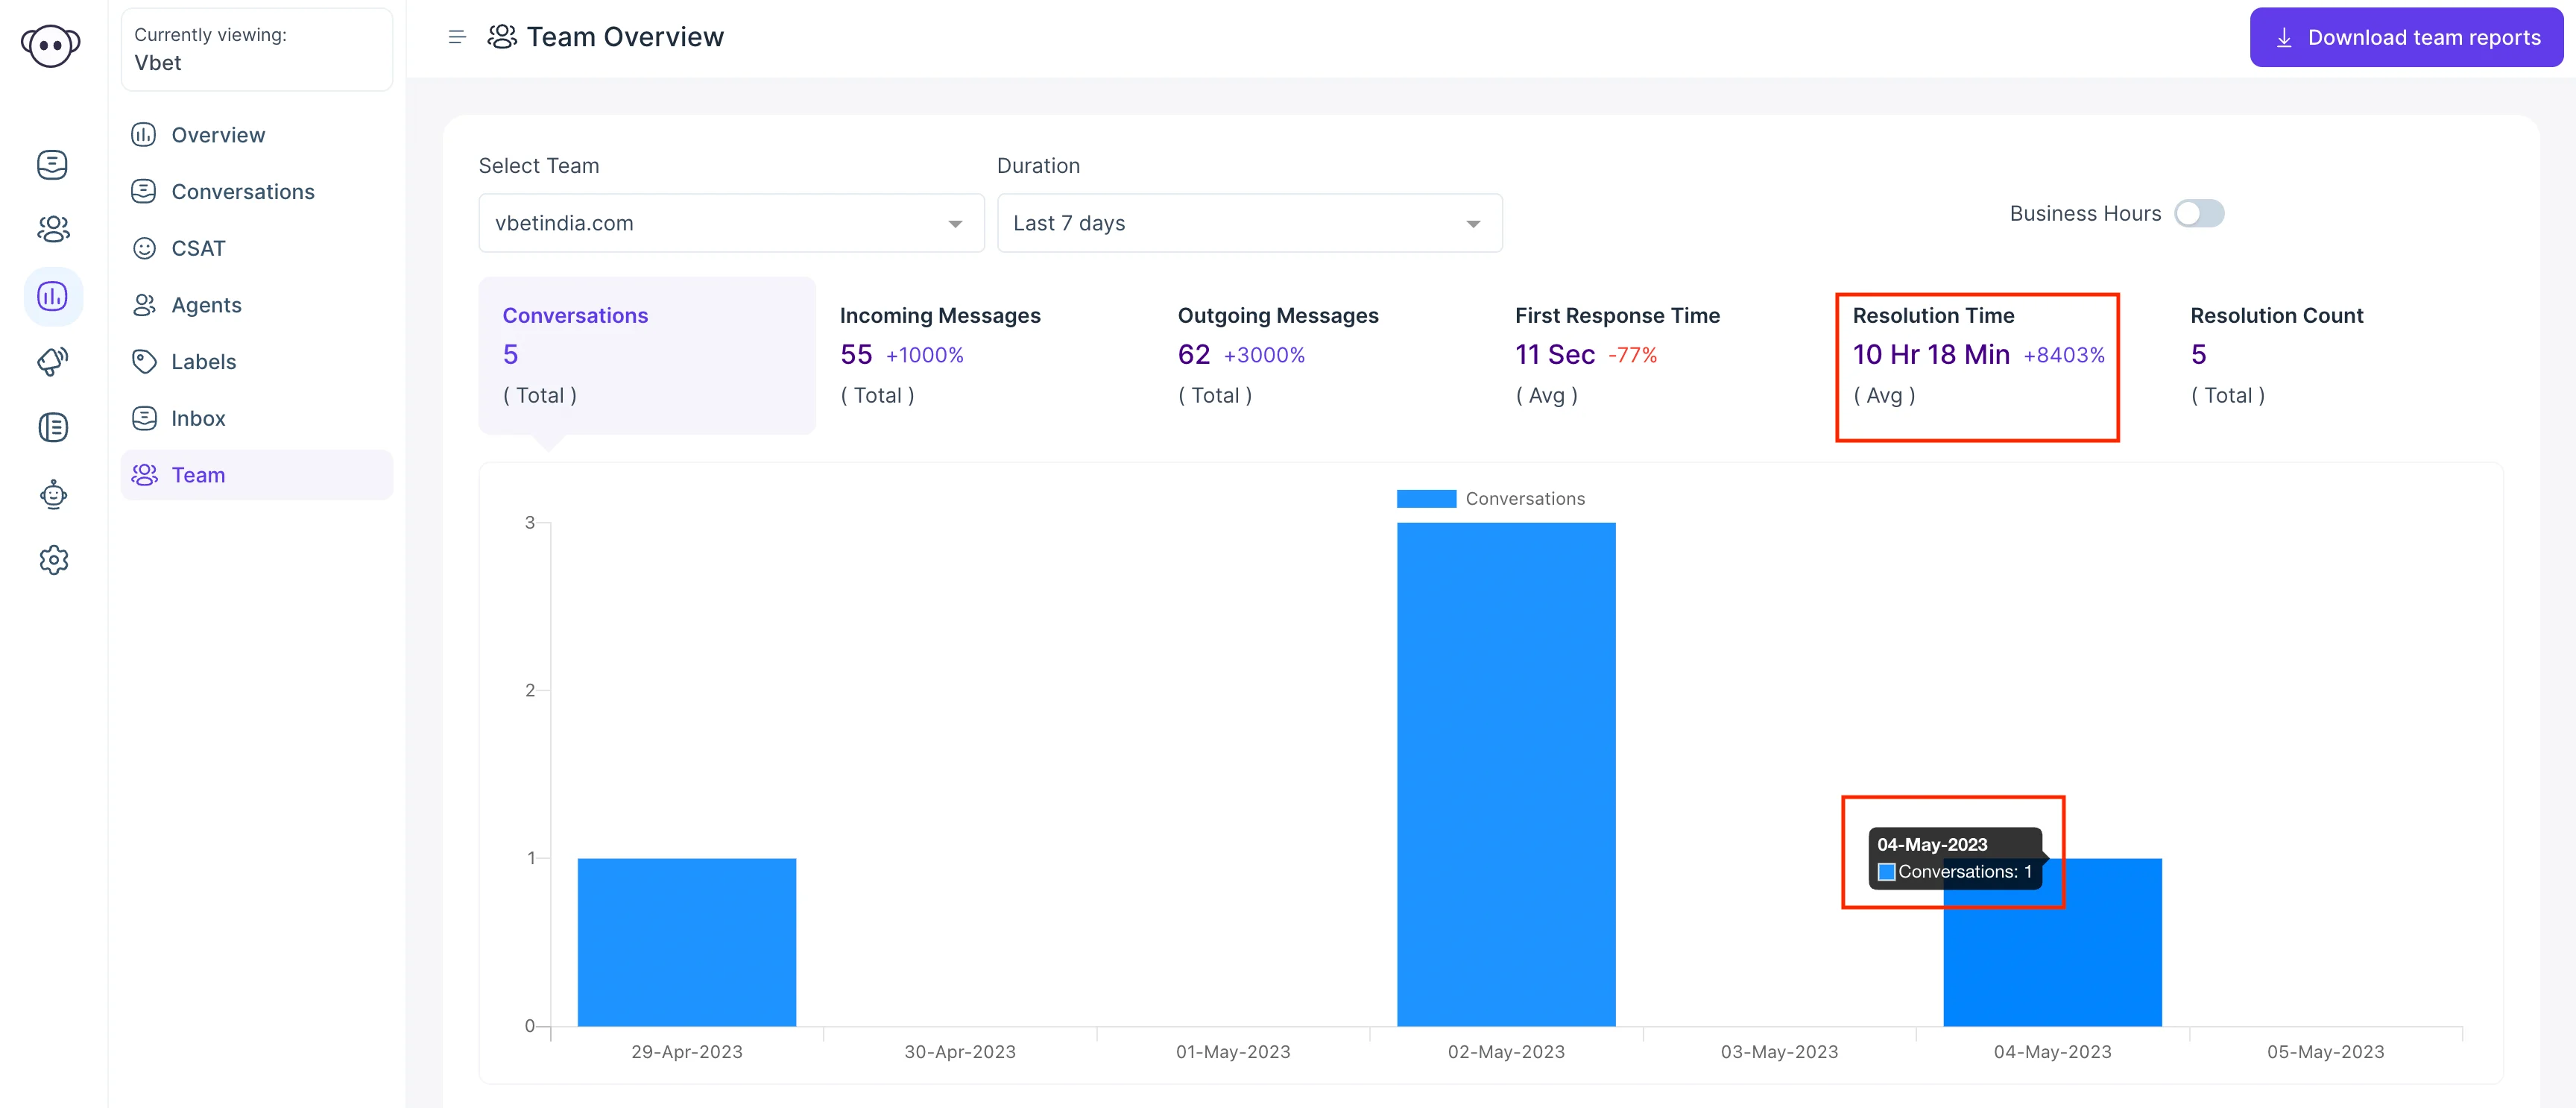
Resolution Time
Click the Resolution Time tab in Reports, and you will find a graph showing the average time to resolve a particular conversation with a customer. Upon pointing the mouse to a particular graph, you will see the average time to resolve conversations and the number of conversations used to calculate the resolution time for that specific day. For example, on May 29, the average first response time was 4 Day 22 Hr based on 8 conversations.
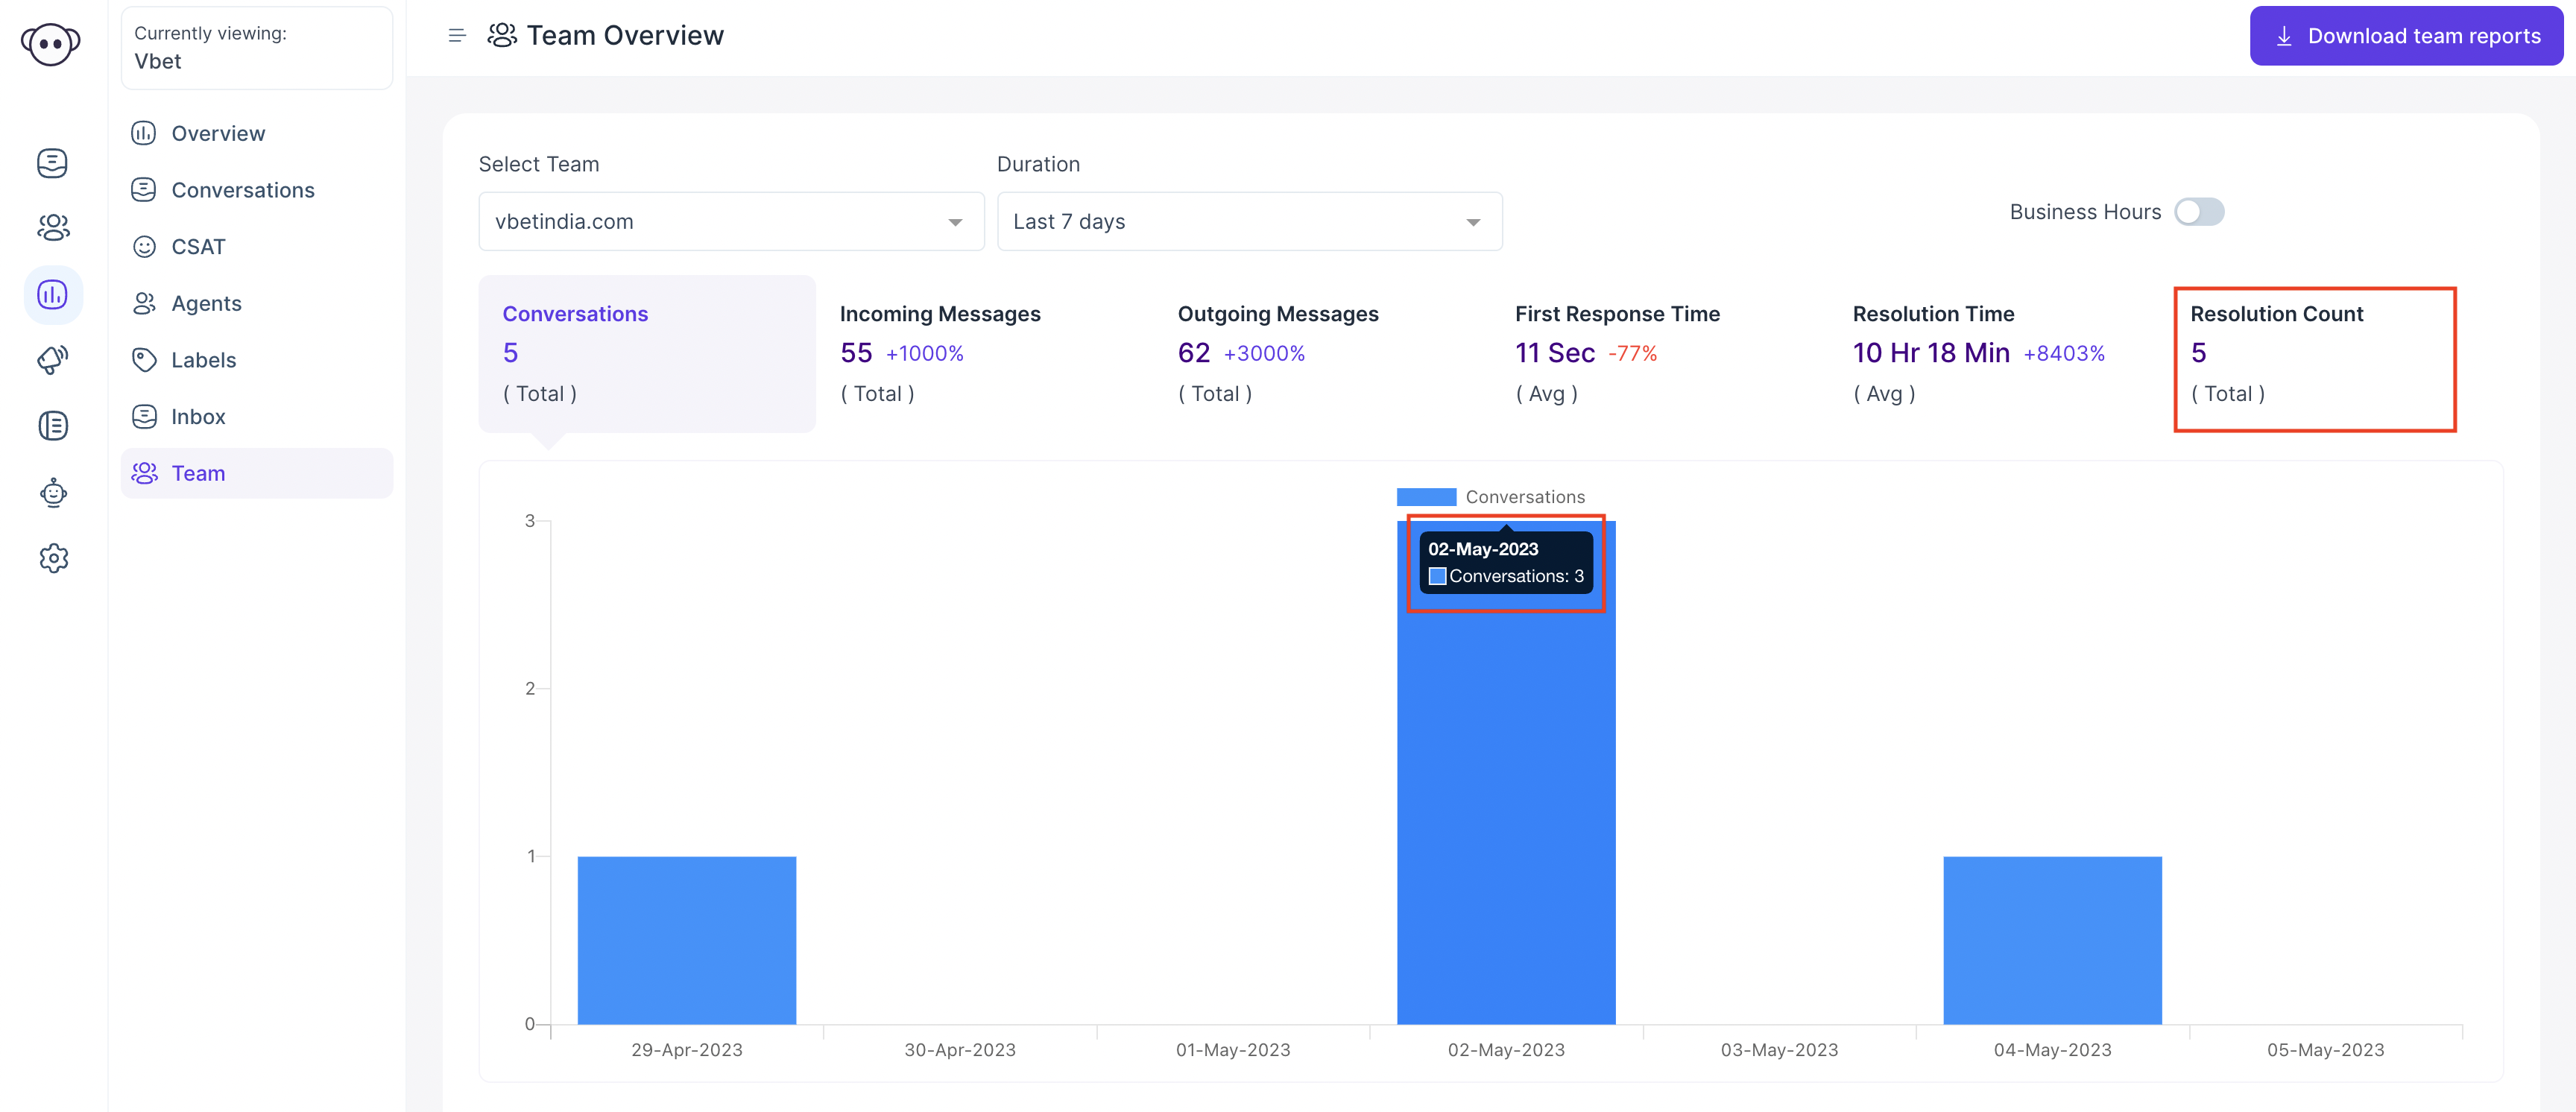
Resolution Count
Click the Resolution count tab in Reports, and you will see a graph showing the number of conversations resolved during the selected date range. Upon pointing the mouse to a particular chart, you will see the details of the number of conversations resolved on that day. An example is given below. On May 28, 11 conversations were resolved.
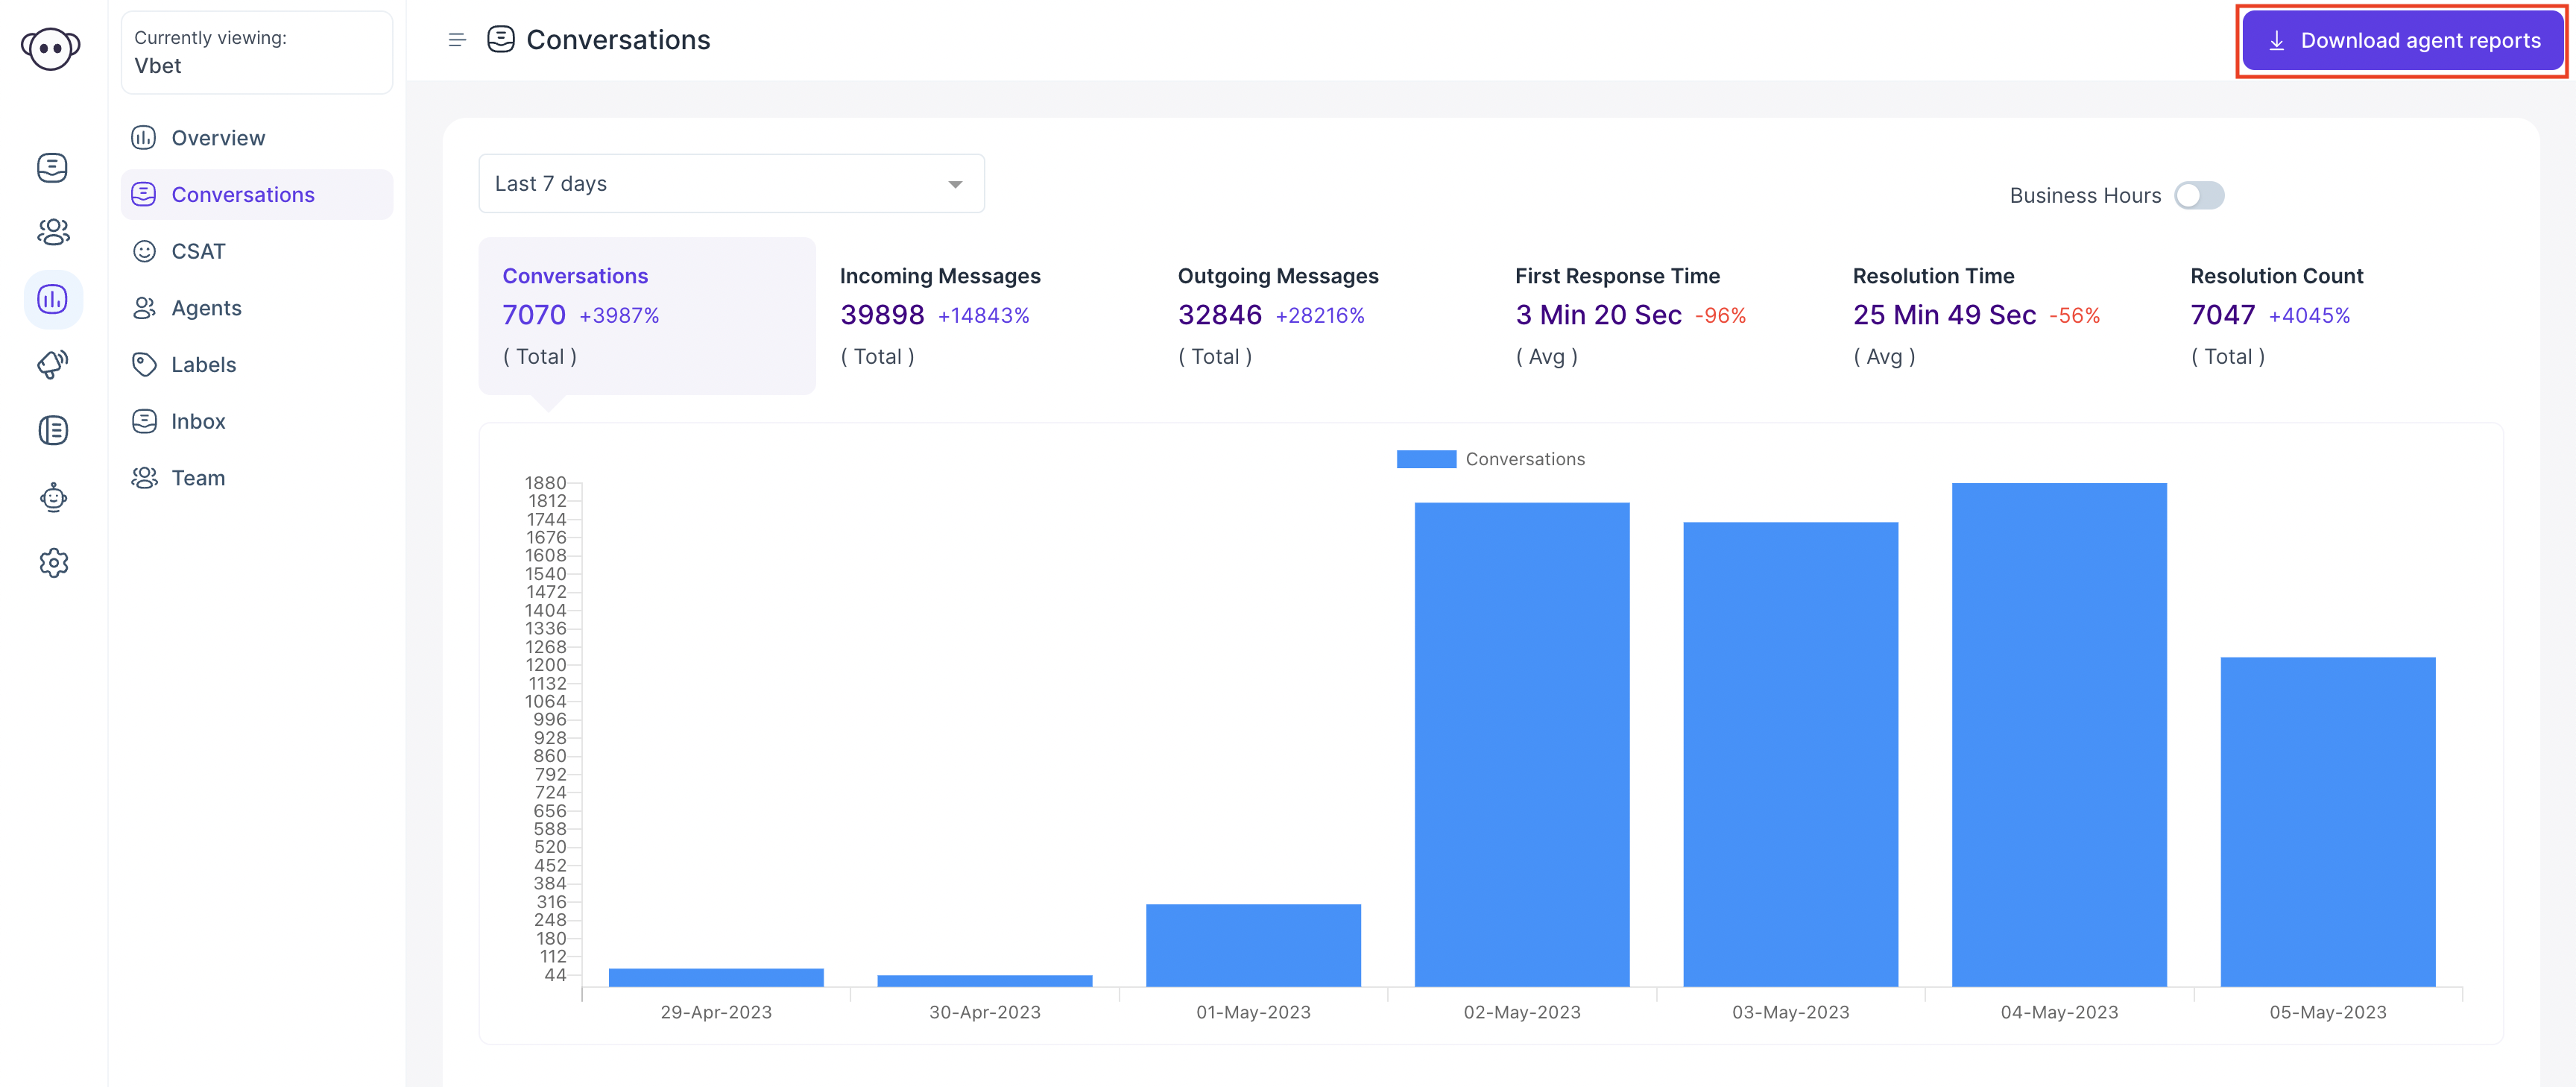
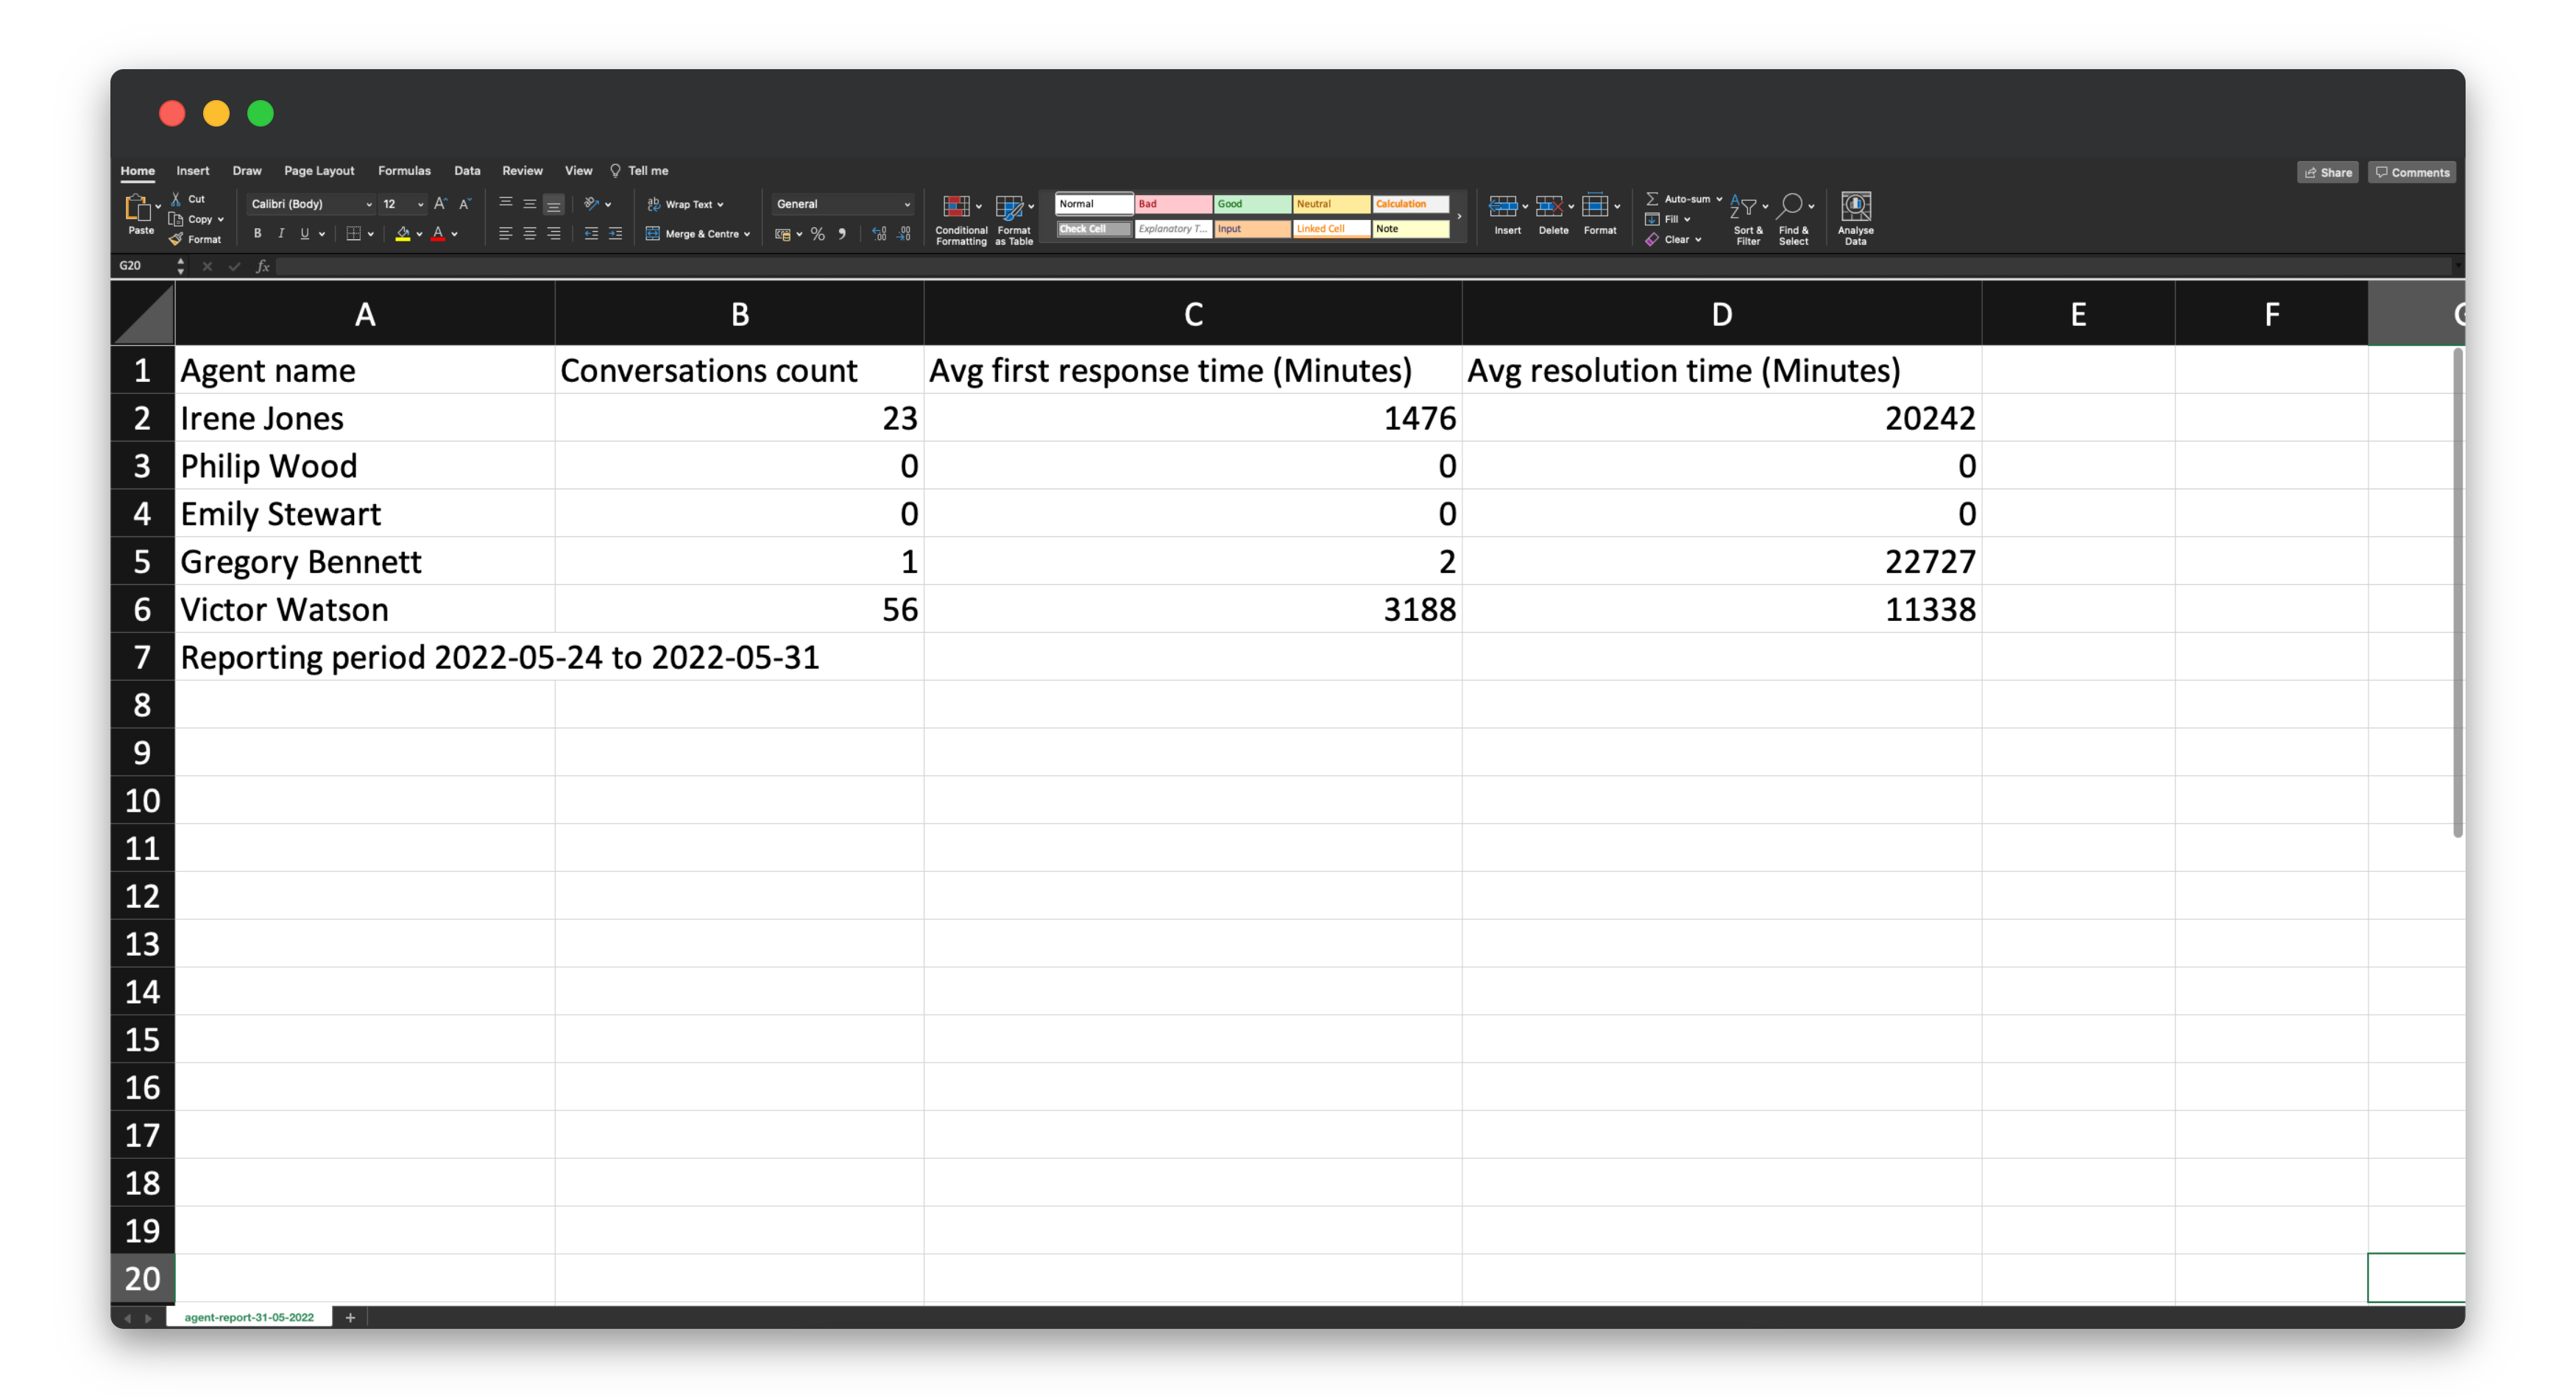
Download Agent Reports
You can create a report of agent performance by clicking the Download Agent Reports button placed on the top right-hand corner of the page. The report will be downloaded in csv format. The example is given below.
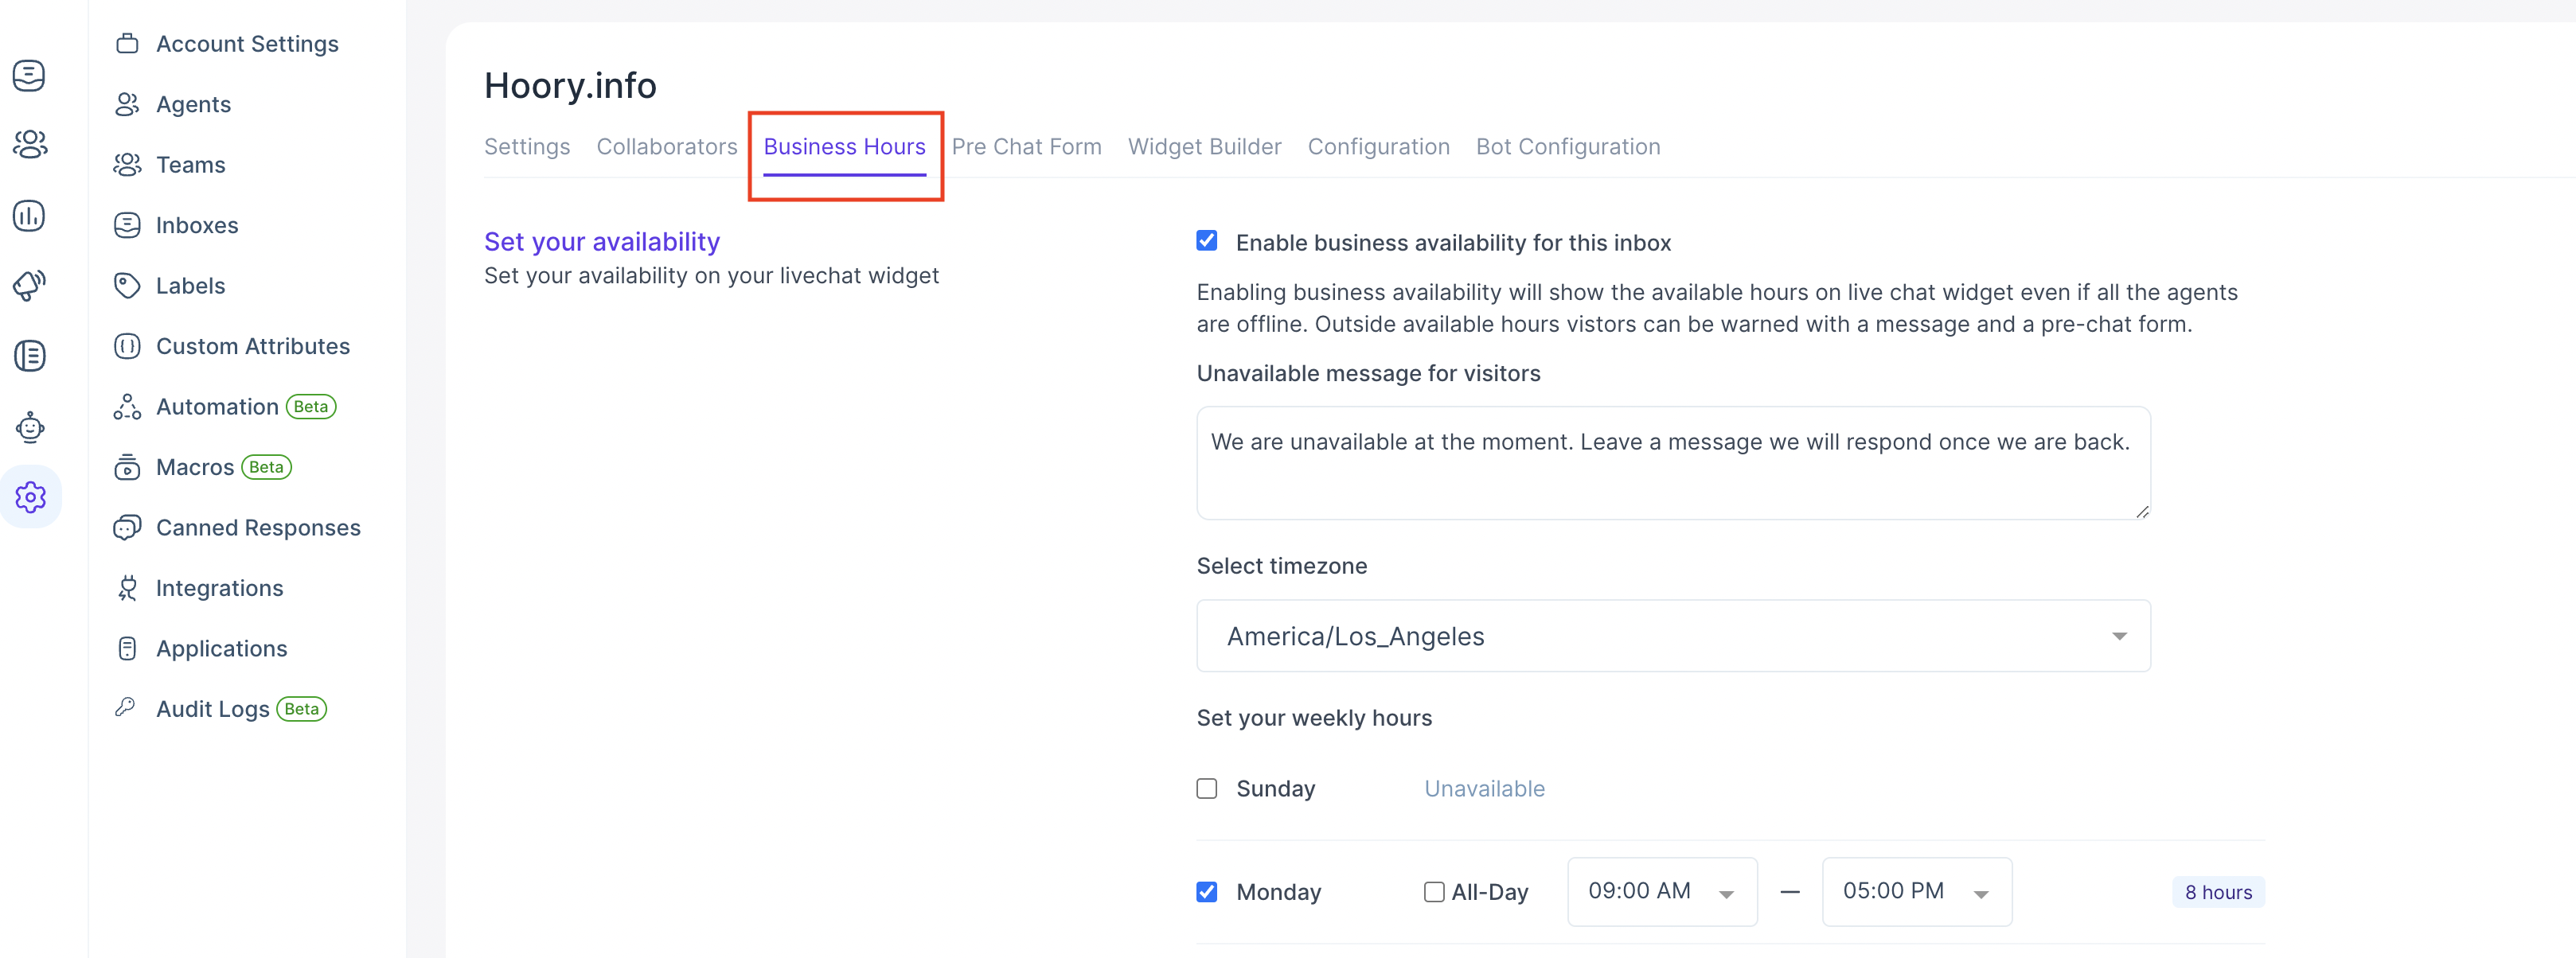
Business Hours
Business hours are used to configure the availabilty of each channel. If business hours are configured, report data will be calculated based on them.
Go to Channel Settings. Click the Business Hours tab and update the availabilty.
Switch on the Business Hours toggle to see reports based on them.
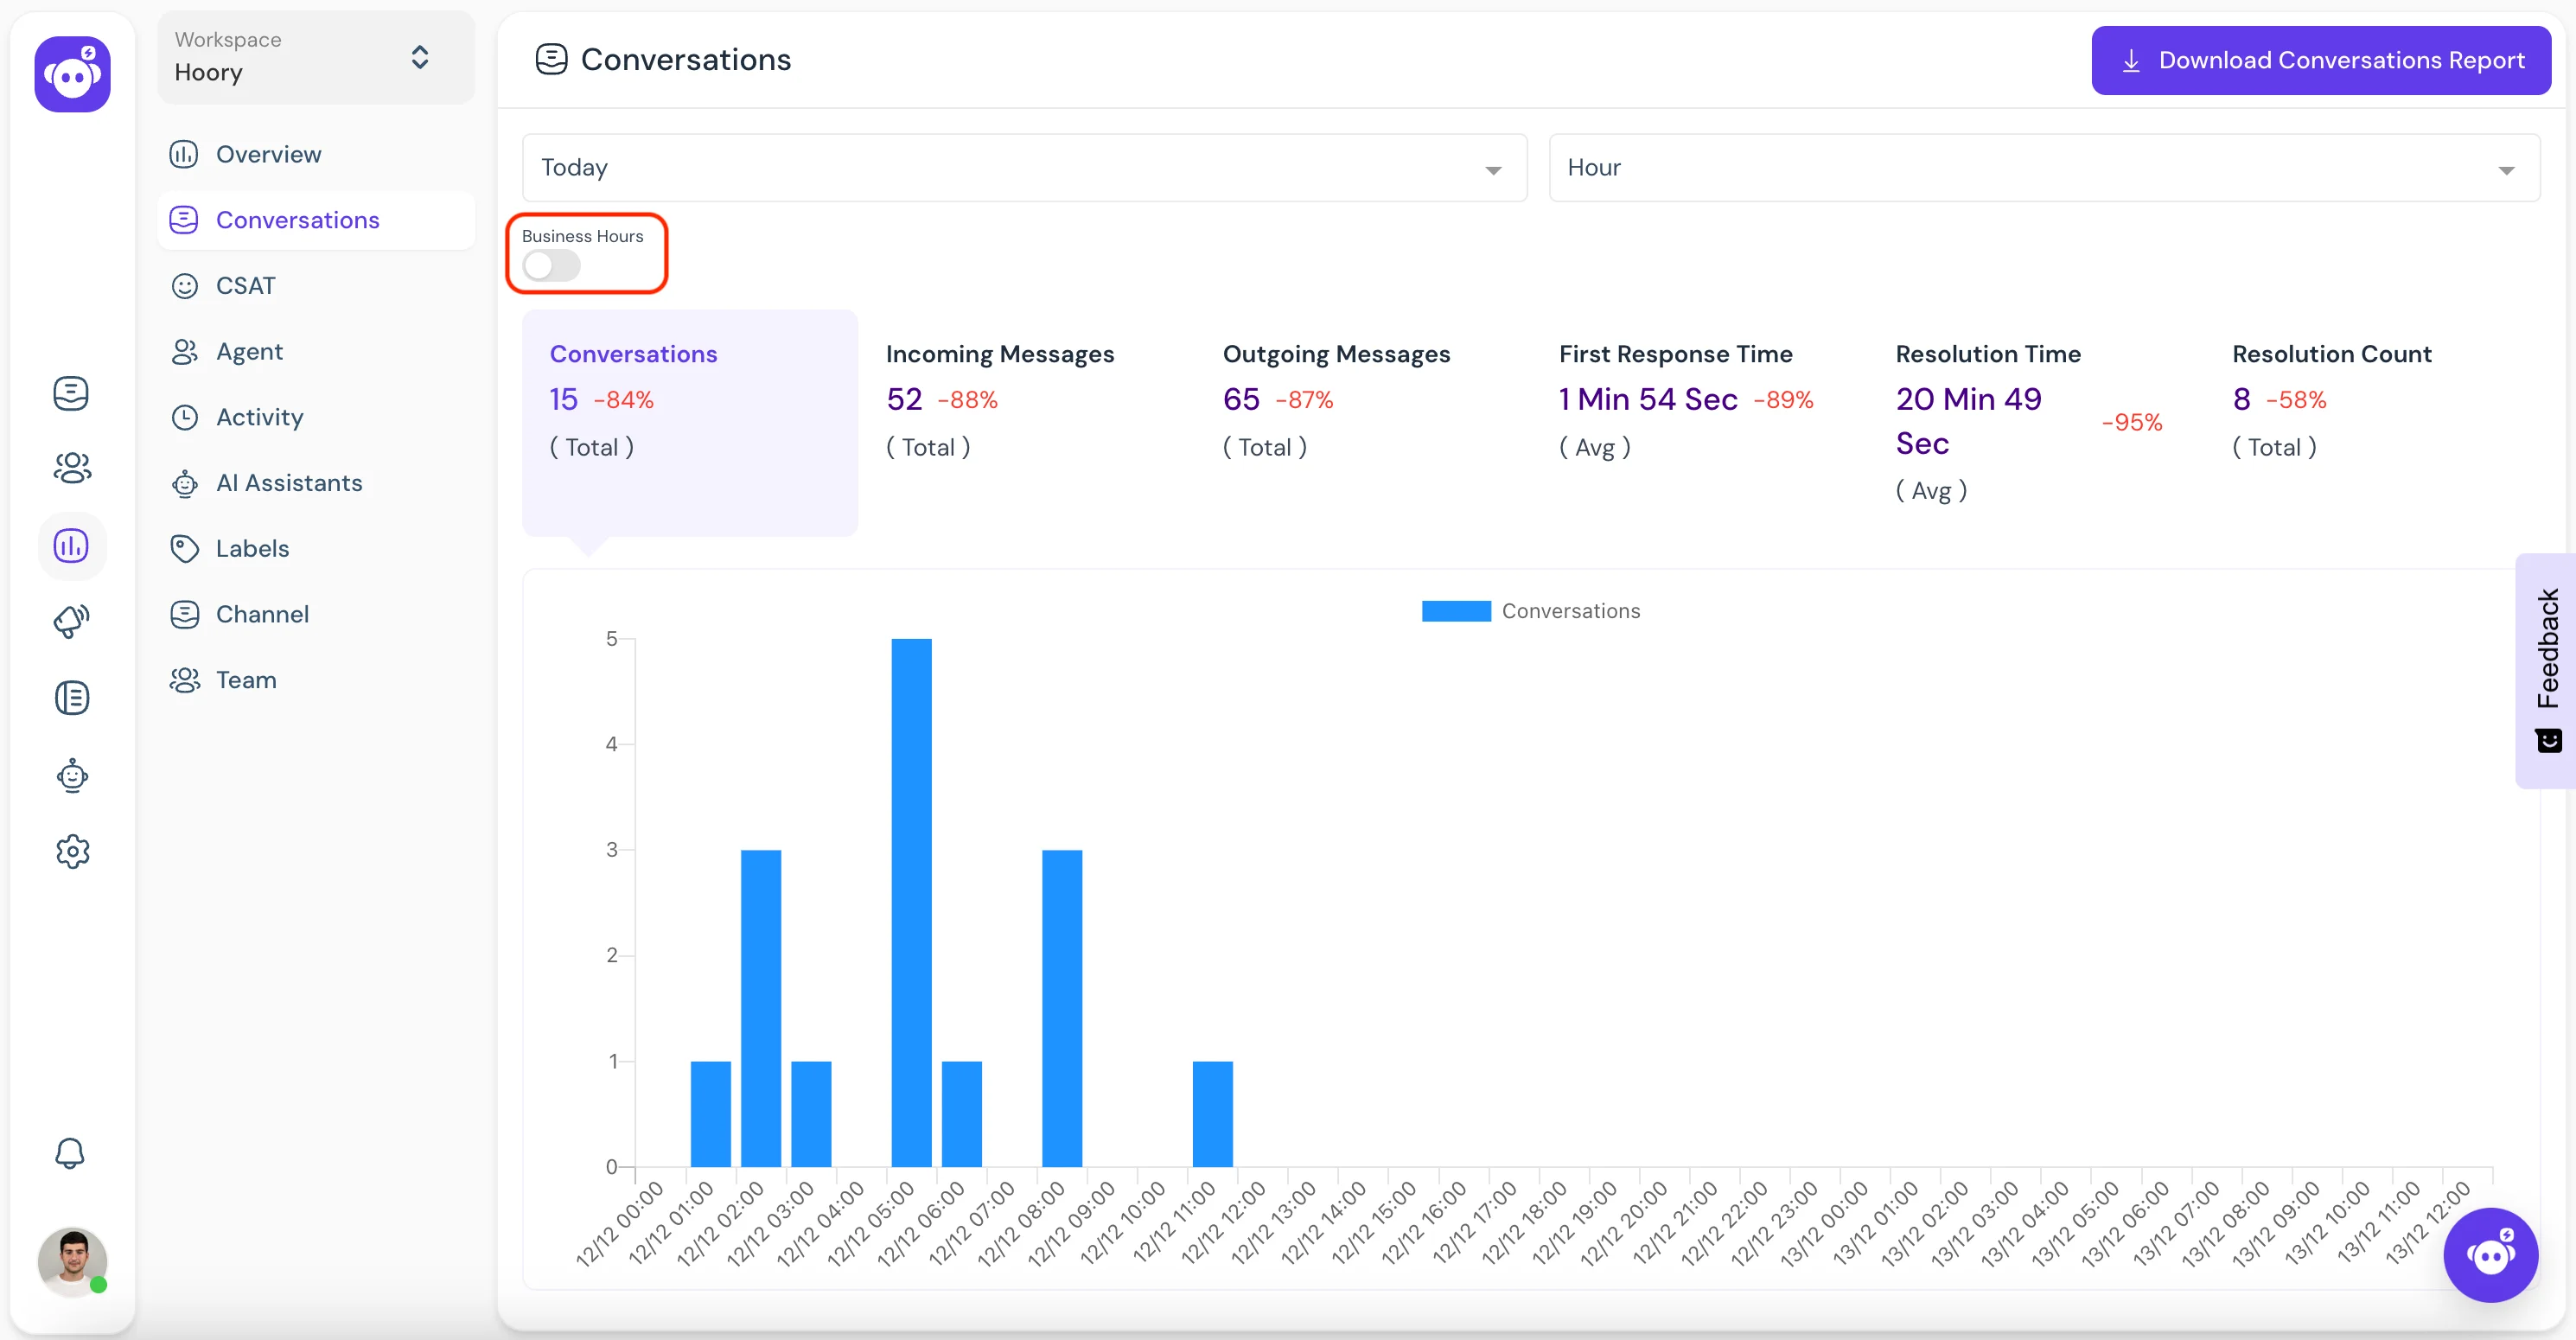
The feature of setting business hours is supported for Conversation, Agent, Channel, Label and Team Reports.
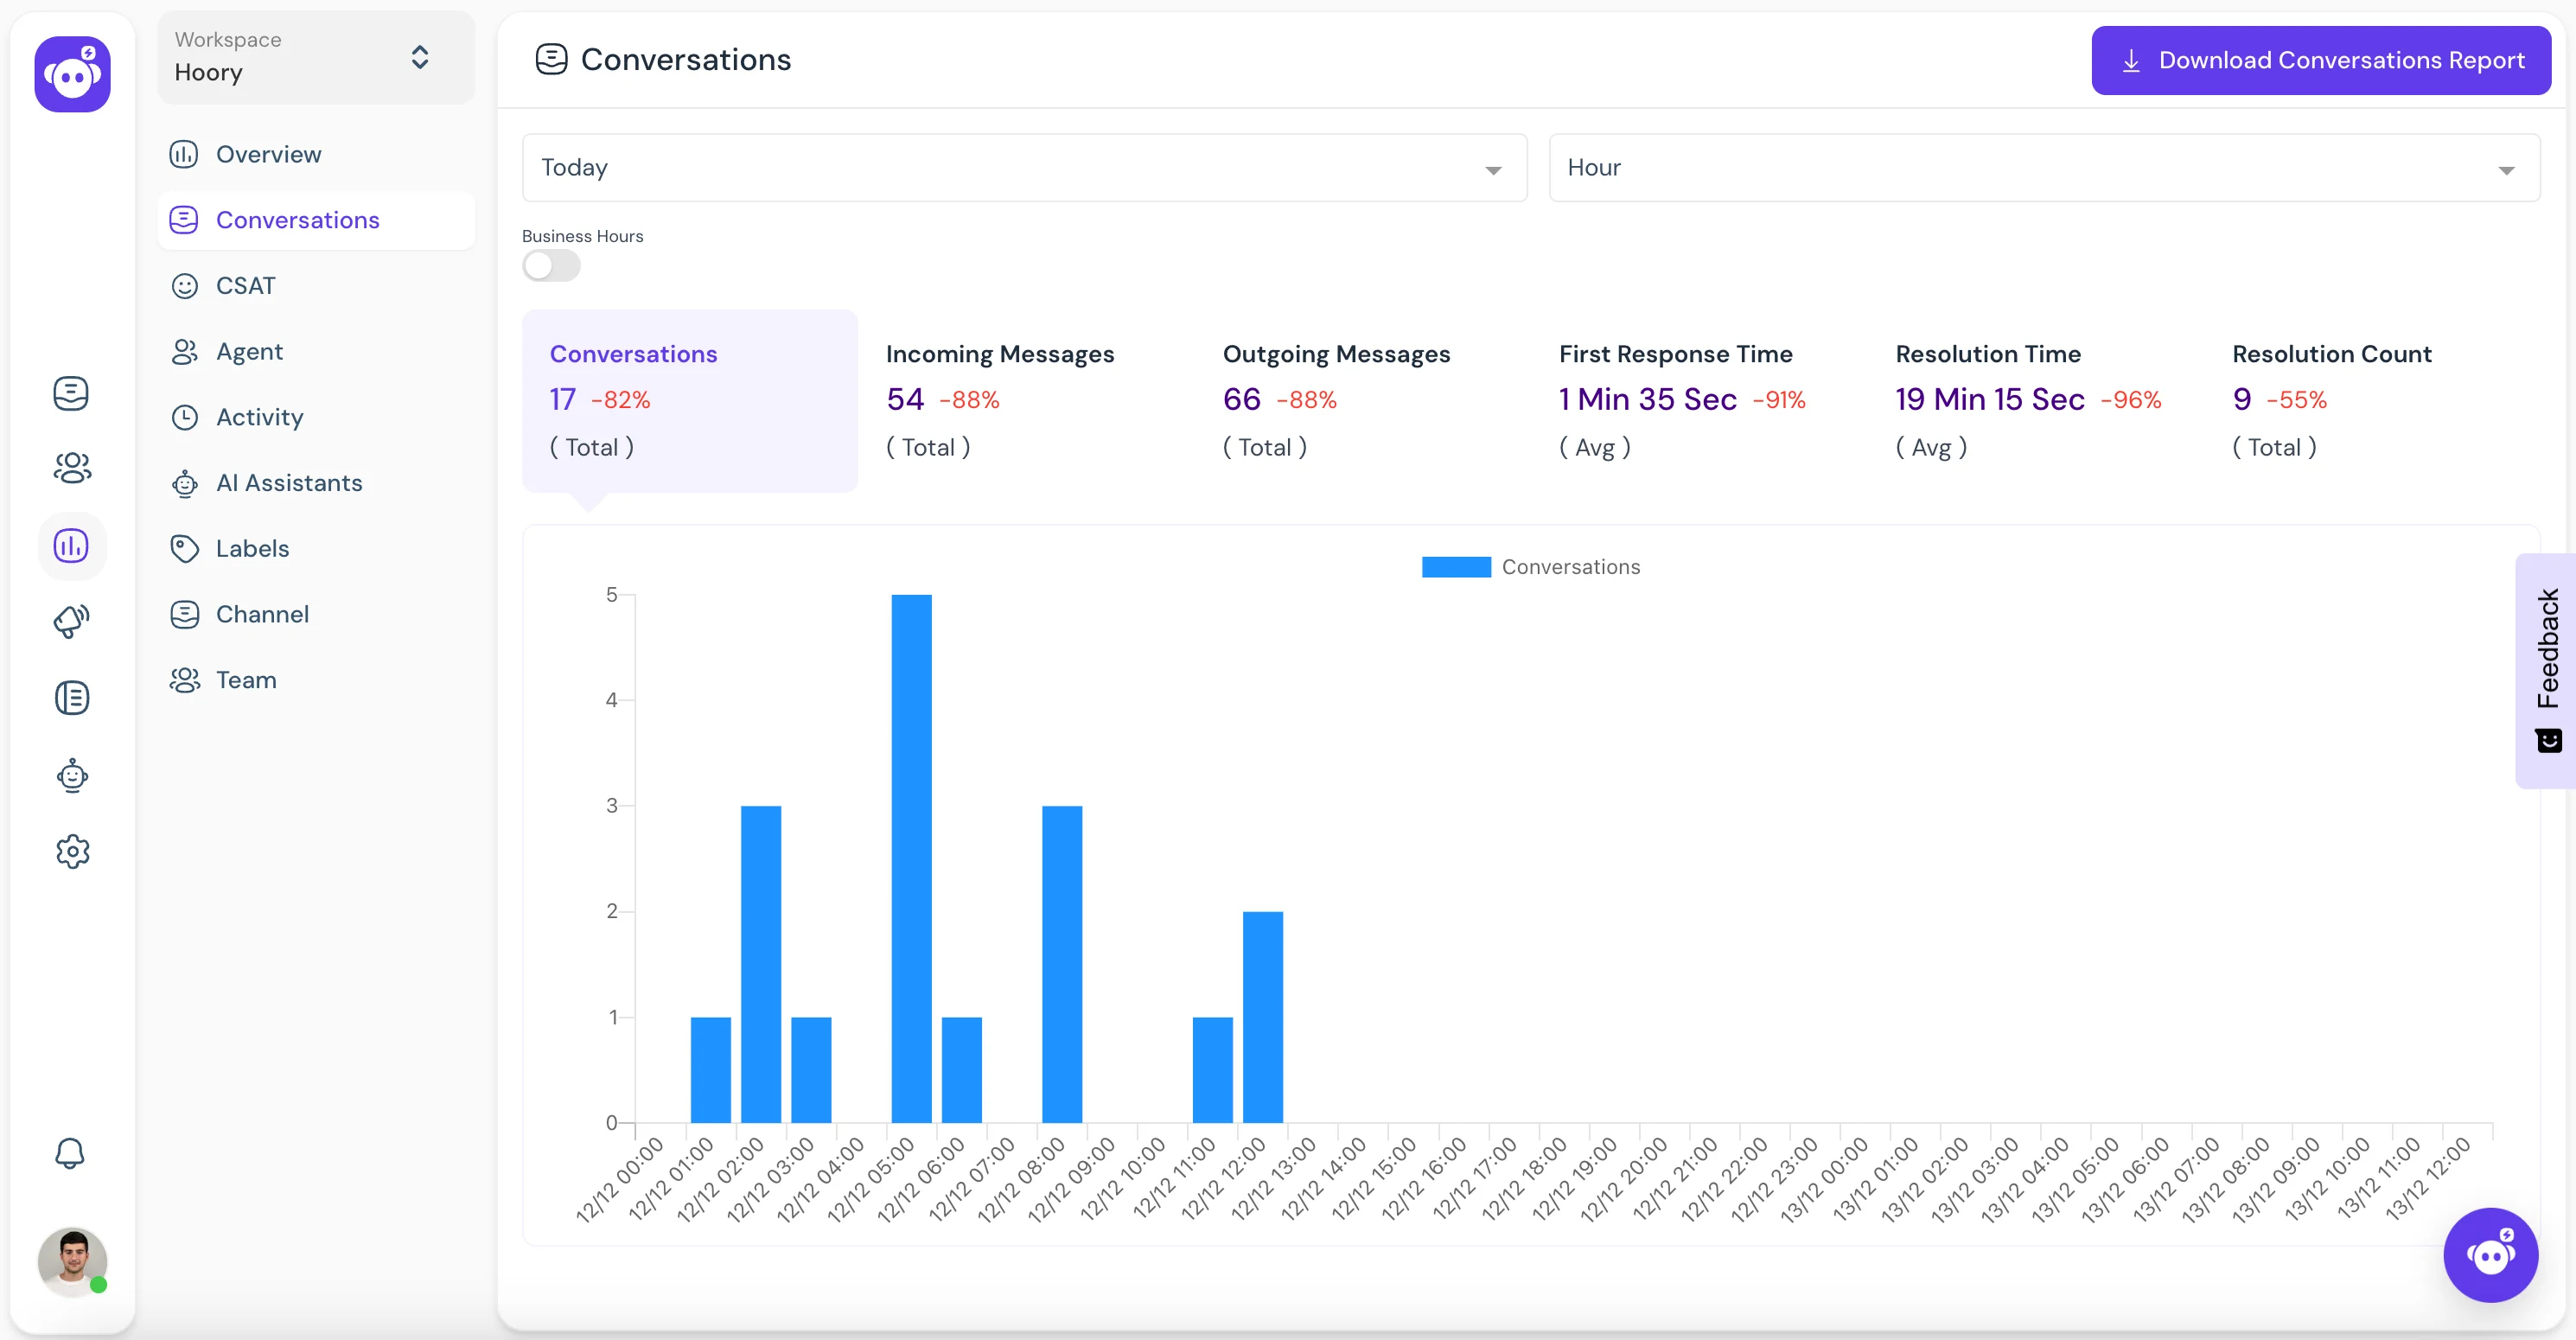
Trend
The trend shows the percentage of increase in the metric data. It is displayed on the right side of each metric in the report. Calculation of trend is given below.
trend = ((current - previous)/previous)*100
The trend feature is supported for Conversation, Agent, Channel, Label and Team Reports.